Offers
The Offers report displays key metrics for product scenarios with typed offer events. The report helps analyze the offer checkout funnel, end‑to‑end conversion, and revenue across various dimensions.
To collect statistics on offers, configure the sending of typed offer events in the app. For more details, see the Offer events in product scenarios section.
Tasks that the report will help solve
- evaluate the effectiveness of the offer processing funnel;
- identify bottlenecks in conversion at each stage of the funnel;
- assess the share of successful, rejected, and pending offers;
- analyze revenue from successful offers;
- compare the effectiveness of different types of offers;
- evaluate profitability of product offers;
- analyze conversion by benefit type;
- evaluate the effectiveness of placements;
- identify problematic stages in the product scenario.
General settings
Select the time period and audience segment. By default, the report shows data for the week, grouped by day. The time in the report is the start of the session on the user’s device, converted to the time zone specified in the app settings.
To set a custom reporting period, use the  button. The selected time interval can be grouped by hours, days, weeks, or months.
Using segmentation you can pull out specific users and compare data from different periods and segments.
In the report, you can configure groupings and metrics.
Configuring the graph with metric selection
On the chart you can select multiple metrics at the same time if they have the same units. If a metric is not available in the list (its name is written in gray), it means that it has a different unit.
Selecting groupings and metrics
The report contains metrics grouped into dimensions.
To set up dimensions and metrics:
-
Click the buttons Dimensions and Metrics.
-
In each window, add dimensions and metrics you want to use to build the report.
-
Configure the order of metrics and dimensions.
The order of metrics determines the order of columns, the order of dimensions determines the nesting of rows in the table.
To restore the default metrics, dimensions, and settings, click Reset.
Groupings
Audience
- Operating system.
- Full operating system version.
- Gender. Determined heuristically using Crypta technology. If the prediction accuracy is insufficient , it takes the
Undefinedvalue. - Age intervals. Determined heuristically using Crypta technology. Possible values:
<18,18-24,25-34,35-44,45-54,≥55. If the prediction accuracy is insufficient, it is Undefined.
Geography
- Continent.
- Country.
- District.
- Region.
- City.
- City size.
Offers
- Offer ID. Offer identifier.
- Product ID. Product identifier.
- Offer type. The type of offer based on the actual values received.
- Benefit type. The benefit type of the offer based on the actual values received.
- Impression source and screen.
- Referrer type. The type of source from which the user came to the offer.
- Screen name. The name of the screen on which the offer was displayed.
- Referrer ID. The identifier of the conversion source.
- Checkout step type. The type of step in the product scenario.
- Checkout step value. The value of the step in the product checkout scenario.
- Offer event type. The type of event associated with the offer.
- Result status. Possible values:
success,declined,pending,cancelled,expired,fail. - Currency. The currency of the offer.
- Offer without amount. A flag indicating that the offer does not contain a numerical amount.
- Parameter. A separate offer parameter.
- All parameters. All parameters related to the offer.
- All parameter values. All values of the offer parameters.
Event date
- Day.
- Week.
- Month.
Application
- Version.
- Build number.
- Bundle ID.
Profile attributes
System
- Country.
- District.
- City.
- Version.
- Build number.
- ID.
- SDK version.
- Operation system.
- Operating system version.
- Manufacturer.
- Model.
- Device type.
- Screen resolution.
- Locale.
- "Root" status.
Install
- Day.
- Week.
- Month.
- Trackers.
- Partners.
- Attribution source.
- All parameters.
Custom
In the application, you can set up your own profile attributes.
Metrics
Structure with groups and nested values:
Offers, events
- Offer events.
- Offer events of the selected type.
- Offers with the selected status.
- Share of offers with the selected status.
- Successful offers with no amount.
Offers, users
- Users.
- Users with an offer event of the selected type.
- Users with an offer in the selected status.
- Offers of the selected type per user.
- Offers with the selected status per user.
Offers, event conversions
- Impression-to-checkout-start conversion.
- Checkout-to-success conversion.
- Impression-to-success conversion.
Offers, financial metrics
- Revenue from offers.
- Average order value (AOV).
- Revenue per offer impression.
- Average revenue per user.
Working with the pending status
The pending status (waiting) is displayed for an event until the S2S integration is ready. You can view the share of events with the pending status in the report.
When the S2S is ready, events with the pending status are updated with the final status success or declined.
End‑to‑end conversion is calculated for events with the success status.
Data Export
You can export data from a report.
The data is exported based on the selected report settings: segmentation, dimension, and time period.
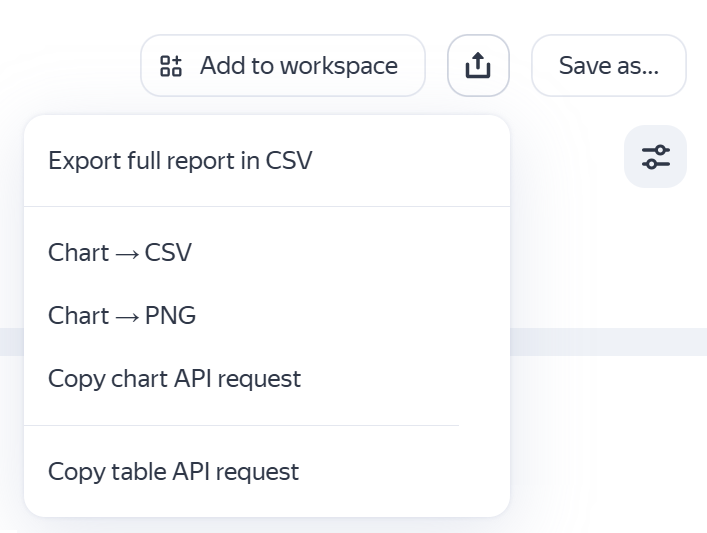
In the upper-right corner click  and select the action:
- Export full report in CSV to export data from the table in
CSVformat. - Chart → CSV to export data from the chart in
CSVformat. - Chart → PNG to export chart images in
PNGformat. - Copy chart API request — Displays the query text for exporting data from the chart using the Reporting API.
- Copy table API request — Displays the query text for exporting data from the table using the Reporting API.
You can use this query to build your own dashboard or create automated data export scripts.
If you are getting the text of the query for the first time, make sure that the browser doesn't block the pop-up authorization window. In the authorization window, allow AppMetrica to access the data.
See also
- Offer events in product scenarios — how to configure the sending of offer events in the app.
If you didn't find the answer you were looking for, you can use the feedback form to submit your question. Please describe the problem in as much detail as possible. Attach a screenshot if possible.