Retention Analysis
This report shows the change in the percentage of users returning to the app over time. For instance, you can estimate:
- User demand for various features of the application.
- How application updates affected retention.
- The user's LTV in the application.
The report allows you to pull out certain users by defining data segments. For example, you can create a segment of users who made a purchase in a certain region. With data segments, you can also set the period of the target action for your report.
To build a report, you need to choose the time period, the audience segment, the grouping type, the cohort size (a date range such as a day, week, or month), and the metric to analyze.
By default, the report shows changes in Retention after the app was installed (day 0), on the following day (day 1), a day later (day 2), and so on. This report will show exactly when users start losing interest in the app.
Grouping data
Grouping allows you to evaluate metrics such as the effectiveness of the advertising partner, campaign performance, and the impact of updates on retention.
The data in the report can be grouped by:
- Installation date.
- Media source.
- Tracker and tracking URL parameters.
To exclude negligible partners, trackers, or tracking URL parameters, specify the minimum size of the cohort. This enables you to focus on the key metrics.
Metrics
Retention, Rolling Retention, and Retention Dynamics are available for analysis.
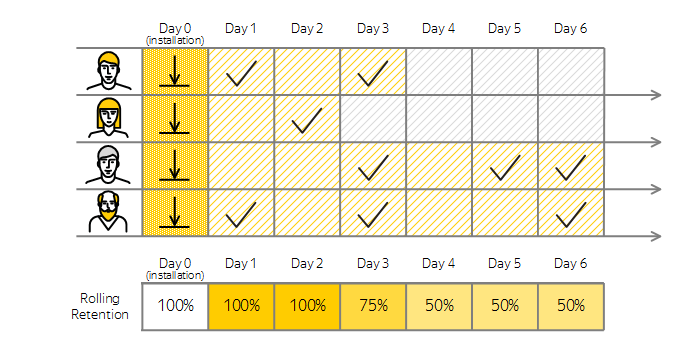
The percentage of users who installed the app during a given day, week, or month (the reference period) and then returned to the app (opened it) on a specific day, week, or month after installing.
This metric is calculated as the ratio of the number of users running the app during the Nth day, week, or month to the number of users who installed the app in the reference period (this number is taken as 100%).
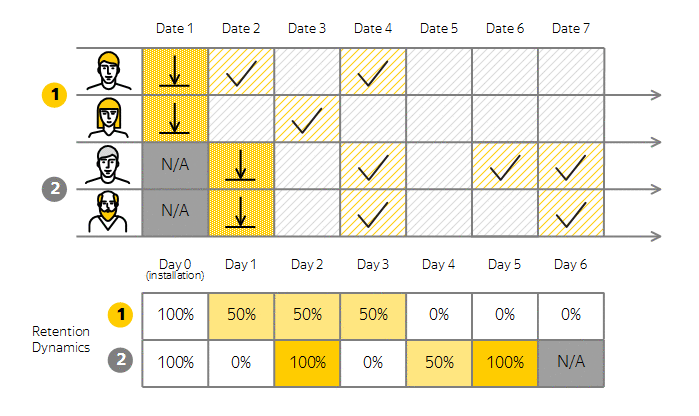
The example above shows the actions of four different users over one week:
- On Day 0, all 4 users installed the application, so the retention metric is 100%.
- On the next day after the installation (Day 1), only 2 out of 4 users opened the app again. The retention metric is 50%.
- On the fourth day after the installation (Day 4), none of these 4 users opened the app. The retention metric is 0%.
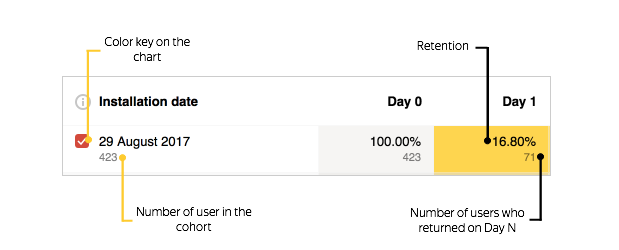
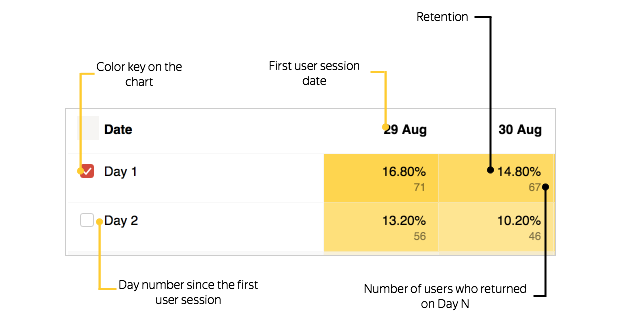
The following metrics are displayed in the report:
-
The color key of metrics on the chart. Enables you to show or hide each metric on the chart.
-
Grouping (by date, partner, tracker, and tracking URL parameters).
-
The total number of users in the cohort for the specified period.
-
The Retention metric value.
-
The number of users who returned to the app on Day N.
-
Rolling Retention
The percentage of users who installed the app during a given day, week, or month (the reference period) and then returned to the app during a specific day, week, or month, assuming they could have potentially returned during the preceding time period. These users are not interpreted as lost (inactive) until the last time they start the app.
To better understand how Rolling Retention works, imagine a user who first opened the app on the day of installation (the reference day), and next opened it on the fourth day after installing. This user is counted as active on the fourth day and for all the previous days, as well. Even though it took the user four days to come back to the app, this was always a possibility during that time.
The example above shows the actions of four different users over one week:
- On Day 0, all 4 users installed the application, so the rolling retention metric is 100%.
- On the next day after the installation (Day 1), only 2 out of 4 users opened the app again. But the other 2 users will return to the application during the selected period (one week), so it is assumed that they were intending to return to the app. The rolling retention metric is still 100%.
- On the fourth day after the installation (Day 4), none of the 4 users returned to the app, but 2 users will return during the selected period. The rolling retention metric is still 50%.
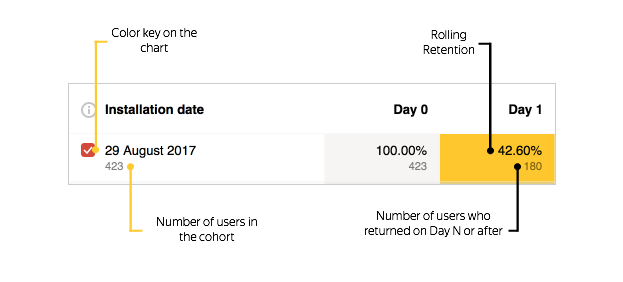
The following metrics are displayed in the report:
- The color key of metrics on the chart. Enables you to show or hide each metric on the chart.
- Grouping (by date, partner, tracker, and tracking URL parameters).
- The total number of users in the cohort for the specified period.
- The Rolling Retention metric value.
- The number of users who returned to the app on Day N.
-
Retention Dynamics
The change in the percentage of users who returned to the app on a specific day, week, or month after installation in the specified time period. This metric allows you to track the Retention metric over time.
The data is grouped only by the date of installation.
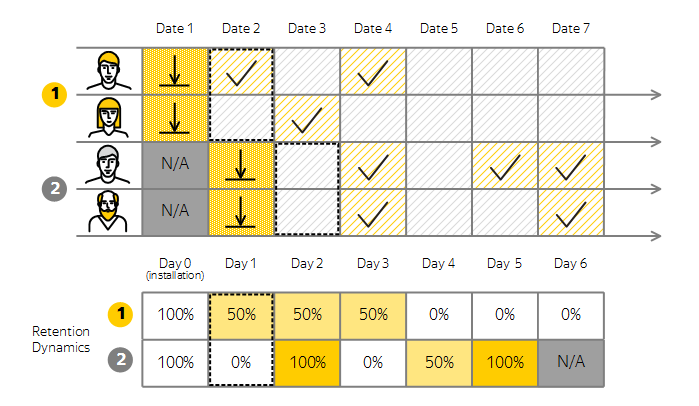
The example above shows the actions of four different users over one week. Users are grouped by the date of installation: the first group installed the app earlier than the second one. The figure shows the following:
- On Day 0, all 4 users installed the application, so the Retention metric is 100% for both groups, despite different installation dates.
- On the next day after the installation (Day 1, which is outlined with a dotted line), 1 user from the first group and none from the second group returned to the app. The Retention metric is 50% for the first group, and 0% for the second. The installation dates are different, and you can track changes in the Retention metric for the specified period after the installation.
- On the sixth day after the installation (Day 6), neither of the 2 users from the first group returned to the app. For the second group, the metric is not available: there is no data to calculate the Retention metric.
The following metrics are shown in the report:
- The color key of metrics on the chart. Enables you to show or hide each metric on the chart.
- The number of the day since the first user session (Day 1, Day 2, etc.).
- The date of the first user session.
- The Retention metric value.
- The number of users who returned to the app on Day N.
Example of Retention calculation
In the example:
Date range is July 1 — October 21.
Grouping by sources is enabled.
The time range is divided into months.
Retention metrics is selected.
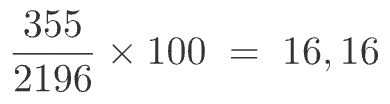
Example of calculating the percentage of users who returned in the first month after installation:
The report displays 19.30%. The resulting numbers differ because the interface displays the number of all returned users grouped by the partner, and the percentage of returns is calculated only for the completed time interval.
For example, it's the 21 of October. For installations made in September, the first month (October) is not over yet. So September is not included into the calculation of the final value of the first month. Therefore, to calculate the percentage of returns in the first month, you need to sum only the values of the zero months, which values are taken into account.
To calculate the percentage of returned users in the first month:
Turn on grouping by installation date.
Enable segmentation by the appropriate installation source.
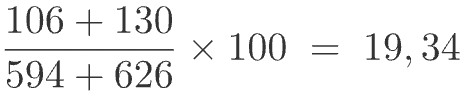
Divide the total number of returned users in the first month by the total number of installations in July and August:
In the report, the value of 19.34 is rounded to a decimal place.
Data export
You can export data by choosing an item from the Export dropdown list above the chart. The data is exported based on the selected report settings: segmentation, grouping, and time period.
The dropdown list contains the following elements:
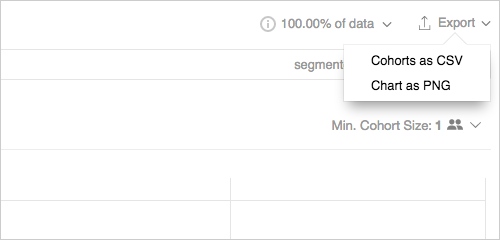
- Cohorts as CSV — Exports the data from the table in the
CSVformat. - Chart as PNG — Exports the chart image in the
PNGformat.
If you didn't find the answer you were looking for, you can use the feedback form to submit your question. Please describe the problem in as much detail as possible. Attach a screenshot if possible.