Push campaigns
The report displays push campaign statistics, including the number of push notifications sent, delivered, and opened.
Using segmentation you can pull out specific users and compare data from different periods and segments.
To build a report, you need to choose the time period, audience segment, and necessary push campaign.
Report period
The report is formed for a specific time period. The default period is one week.
To set a custom reporting period, use the  button. The selected time interval can be grouped by hours, days, weeks, or months.
Dimensions and metrics
The report contains metrics grouped into dimensions.
To set up dimensions and metrics:
-
Click the buttons Dimensions, Metrics, and Data one by one. The Data button is only available for some reports.
-
In each window, add dimensions and metrics you want to use to build the report.
-
Configure the order of metrics and dimensions.
The order of metrics determines the order of columns, the order of dimensions determines the nesting of rows in the table.
To restore the default metrics, dimensions, and settings, click Reset.
Dimensions
Push Campaigns
- Push campaigns.
- Hypothesis.
- Language.
- Send error type.
- Transport.
- Campaign type.
- Push SDK version.
Audience
- Operating system.
- Full operating system version.
- Gender. Determined heuristically using Crypta technology. If the prediction accuracy is insufficient , it takes the
Undefinedvalue. - Age intervals. Determined heuristically using Crypta technology. Possible values:
<18 | 18-24 | 25-34 | 35-44 | 45-54 | ≥55. If the prediction accuracy is insufficient, it is Undefined.
Geography
- Continent.
- Country.
- District.
- Region.
- City.
- City size.
Event date
- Day.
- Week.
- Month.
App
- Version.
- Build number.
Profile attributes
System
- Country.
- District.
- City.
- Version.
- Build number.
- ID.
- SDK version.
- Operation system.
- Operating system version.
- Manufacturer.
- Model.
- Device type.
- Screen resolution.
- Locale.
- "Root" status.
Install
- Day.
- Week.
- Month.
- Trackers.
- Partners.
- Attribution source.
- All parameters.
Custom
In the application, you can set up your own profile attributes.
The data in the report can be grouped by push campaign name. To expand the campaign report, click ![]() in the list of names.
in the list of names.
Metrics
Alert
If A/B testing wasn't configured when creating a push campaign, all statistics are for hypothesis A.
Push Campaigns
-
Sent. Number of sent push notifications.
-
Delivered. Number of delivered push notifications.
By default, for iOS devices, a push notification is considered delivered if it was opened. To track delivery, set up statistics collection for push notifications.
-
Opened. Number of opened push notifications.
-
Conversion from delivered to opened. Ratio of delivered to opened push notifications.
-
Control sample.
-
Error sending.
-
Shown (Android)
-
Push disabled (Android)
Data export
You can export data from a report.
The data is exported based on the selected report settings: segmentation, dimension, and time period.
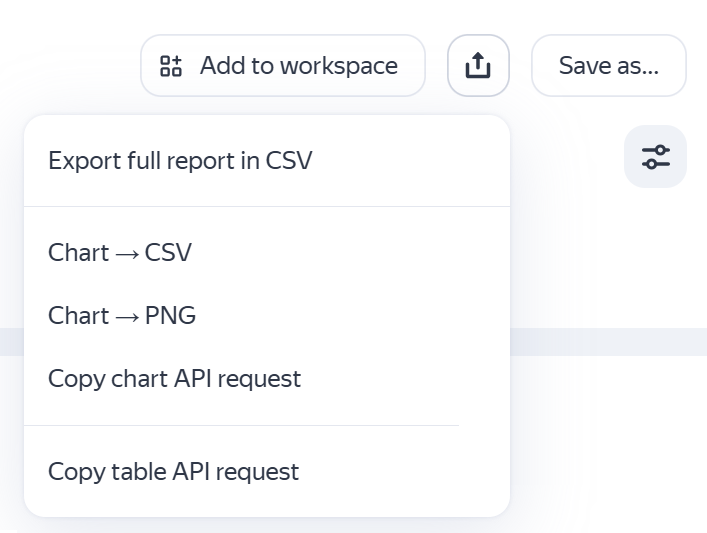
In the upper-right corner click ![]() and select the action:
and select the action:
- Export full report in CSV to export data from the table in
CSVformat. - Chart → CSV to export data from the chart in
CSVformat. - Chart → PNG to export chart images in
PNGformat. - Copy chart API request — Displays the query text for exporting data from the chart using the Reporting API.
- Copy table API request — Displays the query text for exporting data from the table using the Reporting API.
You can use this query to build your own dashboard or create automated data export scripts.
If you are getting the text of the query for the first time, make sure that the browser doesn't block the pop-up authorization window. In the authorization window, allow AppMetrica to access the data.
If you didn't find the answer you were looking for, you can use the feedback form to submit your question. Please describe the problem in as much detail as possible. Attach a screenshot if possible.